Excel Reporting Addin
The Excel addin allows you to insert formulas directly into spreadsheets and extract information from your retail system. You can very rapidly create highly specific reports. The formulas recalculate in real time from your system, so you always have up to date information.
The Excel addin augments the standard Fieldpine reporting by allowing you to easily create a customise reports. Web browser based reports can be saved as excel spreadsheets, basically a copy of the report output at that time, but the Excel addin allows you to create dynamic spreadsheets that can include a myriad of facts
For instructions on installing the Excel Addin, see Excel Addin Installation Instructions.
Concepts
The Excel addin supplies some additional formulas to Excel, the main one being the "pinboard" function, you use these formulas to extract data from your live retail system. The Pinboard() Excel function calculates and returns total type information rather than list reports.
Pinboard
A pinboard returns a single value for a named request. Pinboards can have parameters to select individual details. eg.
	=pinboard("product.description", 22)   Return product description for product number 22
	=pinboard("product.unitprice", B16)   Return the current retail price for the product number stored in cell B16
Pinboards can conceptually be viewed like a giant noticeboard where individual statistics are pinned to the board on post it notes. How and where the value is calculated is not important, Excel simply reports the value.
PinboardArray
The pinboardArray function extends the single cell pinboard function to return a 2 dimensional array of values. eg.
	=pinboardArray("list products")   Returns a list of all known products
	=pinboardArray("list accounts")   Returns a list of all known charge accounts
PinboardArray functions can populate a spreadsheet with bulk data very rapidly. You can select columns (fields or values) to be included directly in the
original request, or use individual pinboards per row returned.
While direct extracts of a table, such as products or customers, are common, PinboardArray can also return complex precalculated values, such as "list payments by department" which allocates the method of payment to product departments in each sale.
Getting Started
The quickest way to learn how to use the Excel reporting is just to try it. There are a couple of key concepts but these can be learnt from one or two examples.
- Start Excel Now.
- If you do not have Fieldpine Global Data addin already installed you need to add this first. Excel Addin Installation Instructions
- Download some of the examples
Examples
End of Day By Store
 Download .XLS file
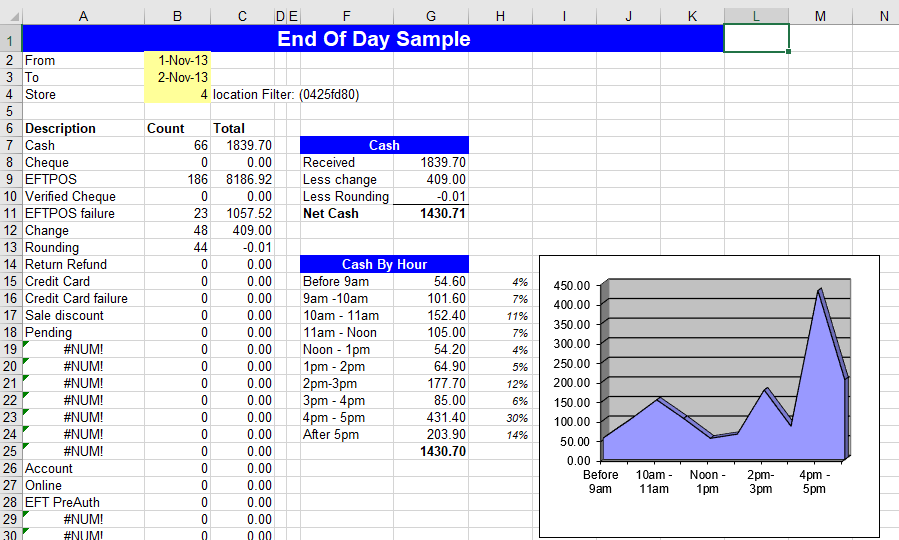
This example shows how a multi store retailer can implement a multi store EOD for individual stores. It uses the pinboards:
- payment.type.description to retrieve method of payment names
- payment.type.total.count to retrieve the volume for individual payment types
- payment.type.total.value to retrieve the gross amount for each payment type
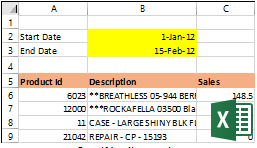
Brief Product Sales Analysis
 Download .XLS file
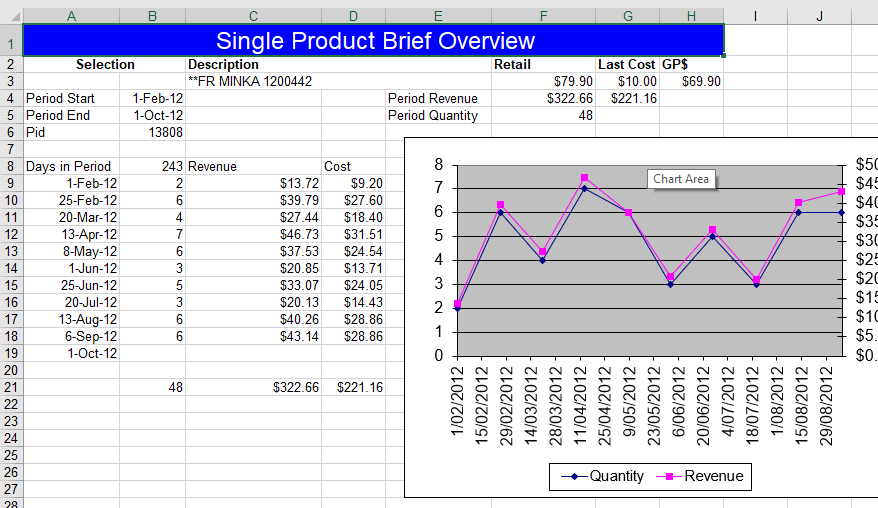
This example shows a simple sales analysis for a single product, showing revenue and cost of goods sold. It uses the pinboards:
- product.description to retrieve the product name
- product.sales.revenue.period to retrieve total gross revenue for a product between dates
- product.sales.count.period to retrieve total volume of a product sold between dates
- product.sales.cost.period to retrieve cost of sales for a product between dates
- product.attribute to retrieve individual pieces of data about a product
Internal Debug Information
 Download .XLSX file
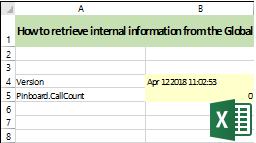
The Globaldata Addin maintains a number of counters and debug support fields. While these are not needed for normal spreadsheet use they can be helpful for support and analysis.
- Uses
=Chip("debug.self", "version")to display the current version of Excel addin being used - Shows how internal counters can be retrieved, such as number of Pinboards that have been requested
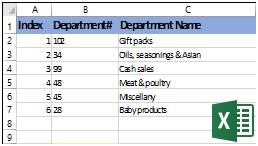
Department Listing
 Download .XLSX file
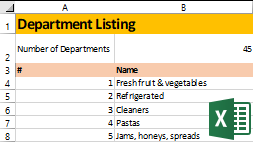
Shows a department list with names of departments and number of products in each department. It then adds strikerate (percent of baskets that include a product from this department) for this year and last 5 years. Stock on hand quantity and value (using last cost) and also added for stores that maintain accurate stock levels.
- Requires Excel addin dated 15 April 2018 or higher, and Gds Server 15th April or higher.
- Uses a "descriptive" or search style method of naming pinboards so that you do not need to precisely identify pinboard names.
- department.strikerate
- stock.level.department
- stock.value.department
Variable Department Listing
 Download .XLSX file
An alternative method of listing departments and products within those departments. This example shows how to use "department list" to retrieve a list of department id numbers, and then use the ELEMENT() function to retrieve each value in turn
- Requires Excel addin dated 25 April 2018 or higher, and Gds Server 25th April or higher.
- "department list" to retrieve all department ids
- ELEMENT(string-list,Index) to extract each member of the list in turn
- "department product list" to get a list of products in a department
Totals by Value using Excel SUMIF
 Download .XLSX file
Uses the Excel SUMIF function to produce totals on a field that isn't available as a total already. In this case a list of products and revenues are displayed alongside the "u_brandname" field, which is a site specific customisation. The individual product totals are then amalgamated via Brand to display a total for each brand.
- product.description
- product.sales.revenue.period
- product.attribute and Excel TRIM() to clean the value up
- Excel SUMIF to total by attribute value
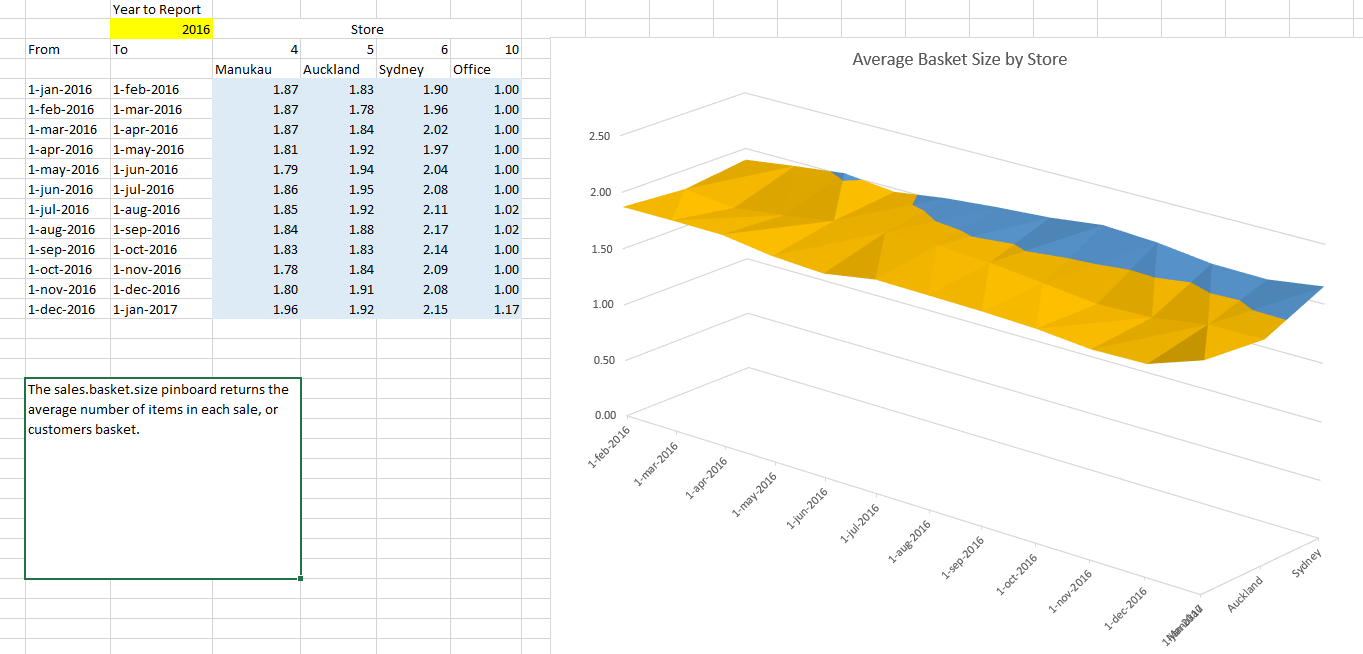
Basket Size Information
 Download .XLSX file
Reports average customer basket sizes by store and date range. Also includes a section showing the distribution of the different basket sizes observed.
- sales.basket.size
- sales.basket.counts
- Element() to extract a single value from a list