Report Customisation
Some Fieldpine stock reports can be customised to let you
- Add or remove columns by default
- Rearrange the column order
- Provide background and highlighting colours
- Alter fonts
What is a Report?
On this page, we are discussing tabular style reports, not various other report styles. When using creating a tabular (aka grid) report, the following shows the flow
| Source data is selected | Data is placed into columns/rows | Broad styling is applied (ie dates are formatted) |
Per cell styling applied |
| All products sold this week | Show Pid, description, Count sold | Highlight negatives in red |
For Javascript Developers
Reports are built by
- Preparing the main drive query "all products sold this week".
- Defining the columns, which also identifies where the data comes from
- Creating any custom callback functions to manipulate individual cell values
- Defining "rules" to be run for each row value inserted into a column. Rules can alter the value shown to the user and also alter CSS attributes.
Users of the report are given some ability to work with #2 (add/remove columns) and #4 (define rules)
Simple Column
This column sources its data from the "sales" field in the main drive query
{
    title: "Sales",
    data: "sales",
    sorttype: "number",
    displaytype: "money2",
    visible: 1
}
Lookup/Map Column
This column retrieves a related product field/attribute. Invariably the main drive query never has all the data users what to see, so a lookup column can insert direct attributes. In this case, the Manufacturer Part Code is being displayed for a report that has product PID values
{
    title: "Manu Part Code",
    id: "product manupartcode",
    sorttype: "string",
    visible: 1,
    dmet: "products,manupartcode",
    valueurl: "/o3/dataread/products/pid/manupartcode",
    valuekey: "product pid"
}
Using a Callback Function on a Column
Sometimes, you simply need to use actual Javascript code. In these cases you can declare a "datafunction" which is called for each row to supply the output value. In this example we can calling a function that will return the URL for an image to display.
{
    title: "GP%",
    datafunction: tpdt_getgpchart,
    presentation: "img",
    visible: 1
}
Using a Pinboard in a Column
Fieldpine has a rich set of lookup functions called "pinboards" available to Excel users. Reports can also invoke pinboards to return values. From a programmers viewpoint, consider a pinboard to be a callable function which receives a small number of arguments and returns a result. For example value = Product.Sales.count.period(PID,FROM-DATE,TO-DATE,STORE)
{
    colid: "writeoffvalue",
    title: "Writeoff $value",
    visible: 1,
    displaytype: "money2",
    displayhidezero: 1,
    valuepinboard: "product.writeoff.value",
    pinboardargs: ["product pid","param startdt","param enddt","param location"],
	valuekey: "product pid"
}
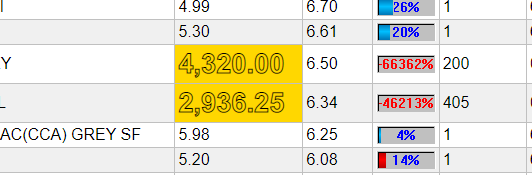
Rules
Rules are an array of conditional logic that is checked for each row displayed in a column. The rules are defined at the column level, and each column can have its own rules.
rules: [
{
    "test": "Number(row.value) > 30",
    "style": {
        "backgroundColor": "hotpink",
        "fontWeight": 700
    }
},
{
    "test": "Number(row.value) > 0",
    "style": {
        "backgroundColor": "lightblue"
    }
},
{
    "test": "Number(row.value) == 0",
    "text": "Zero!!!!!"
}]